enhancedGraphics

A passthrough mapper for charts and gradients
## *Core App*: enhancedGraphics ### Note: This app is pre-installed in Cytoscape 3.10 or later **_You should not download this app_ from the store yourself. If Cytoscape detects that a new version is available in the App Store, it will notify you as it's starting and will give you a chance to download it directly.** **_You should not download this app_ if your Cytoscape is earlier than 3.10. An earlier version of this app is pre-installed in your Cytoscape, and this app cannot replace it.** 
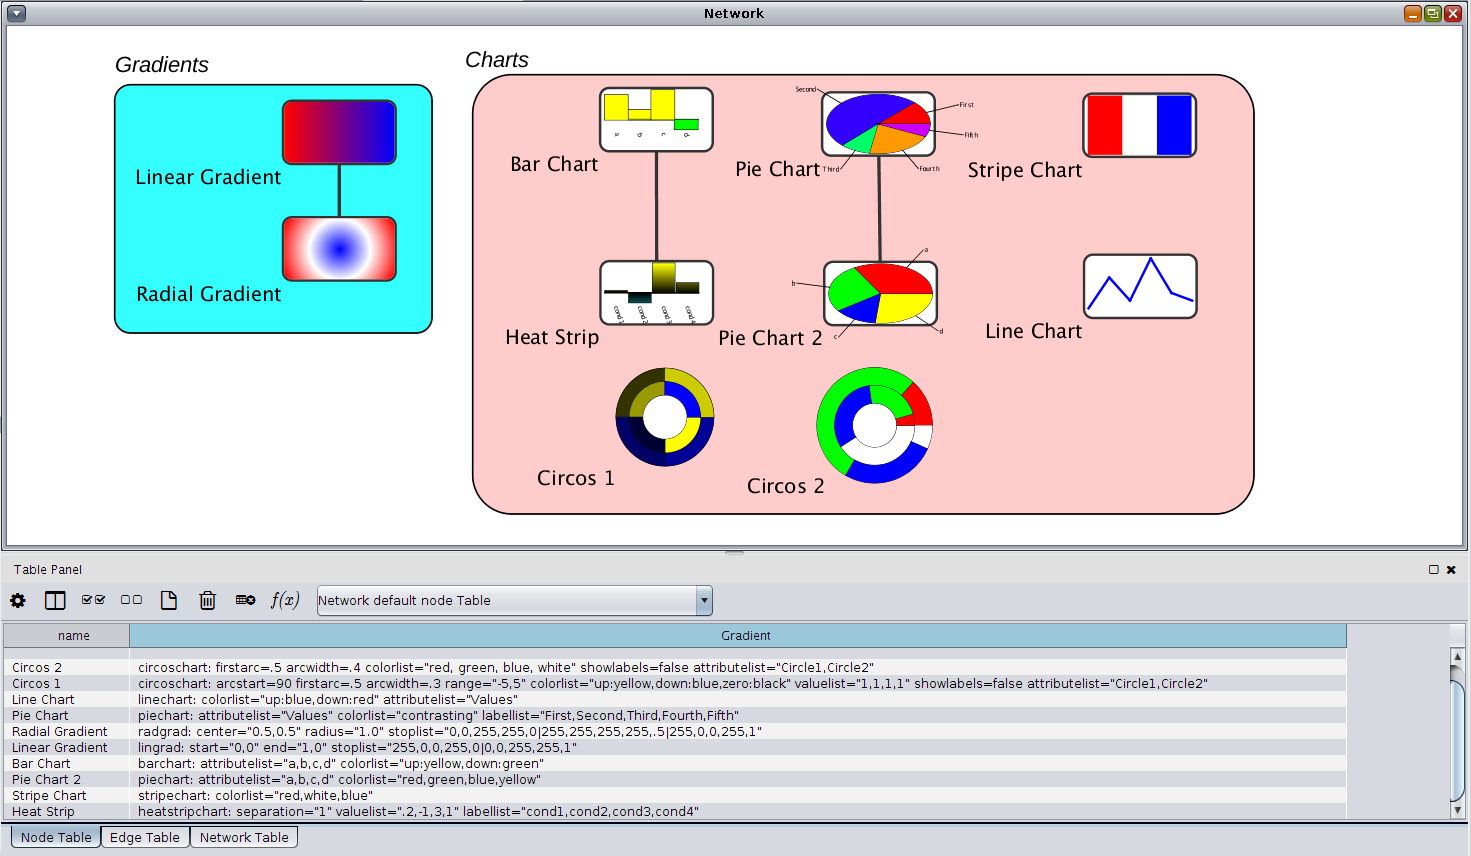
Adding a chart to a node is simple: 1. Create a new text column in the node table 2. Add the chart instructions (see below for samples) 3. Set up a visual style that uses the column you created as a passthrough mapping for one of the CustomGraphics styles. 
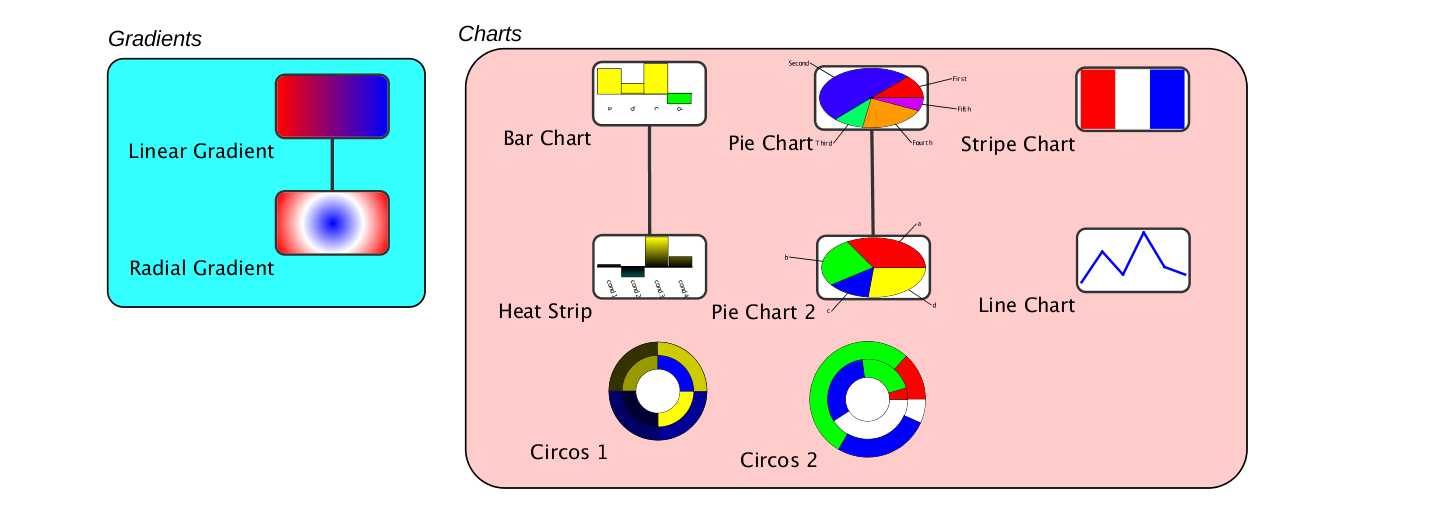
Some example chart instructions: * Gradients: * radgrad: center="0.5,0.5" radius="1.0" stoplist="0,0,255,255,0|255,255,255,255,.5|255,0,0,255,1" * lingrad: start="0,0" end="1,0" stoplist="255,0,0,255,0|0,0,255,255,1" * Basic charts: * linechart: colorlist="up:blue,down:red" attributelist="Values" * piechart: attributelist="Values" colorlist="contrasting" labellist="First,Second,Third,Fourth,Fifth" * piechart: attributelist="a,b,c,d" colorlist="red,green,blue,yellow" * barchart: attributelist="a,b,c,d" colorlist="up:yellow,down:green" * stripechart: colorlist="red,white,blue" * heatstripchart: separation="1" valuelist=".2,-1,3,1" labellist="cond1,cond2,cond3,cond4" * Circos charts: * circoschart: firstarc=.5 arcwidth=.4 colorlist="red, green, blue, white" showlabels=false attributelist="Circle1,Circle2" * circoschart: arcstart=90 firstarc=.5 arcwidth=.3 range="-5,5" colorlist="up:yellow,down:blue,zero:black" valuelist="1,1,1,1" showlabels=false attributelist="Circle1,Circle2"
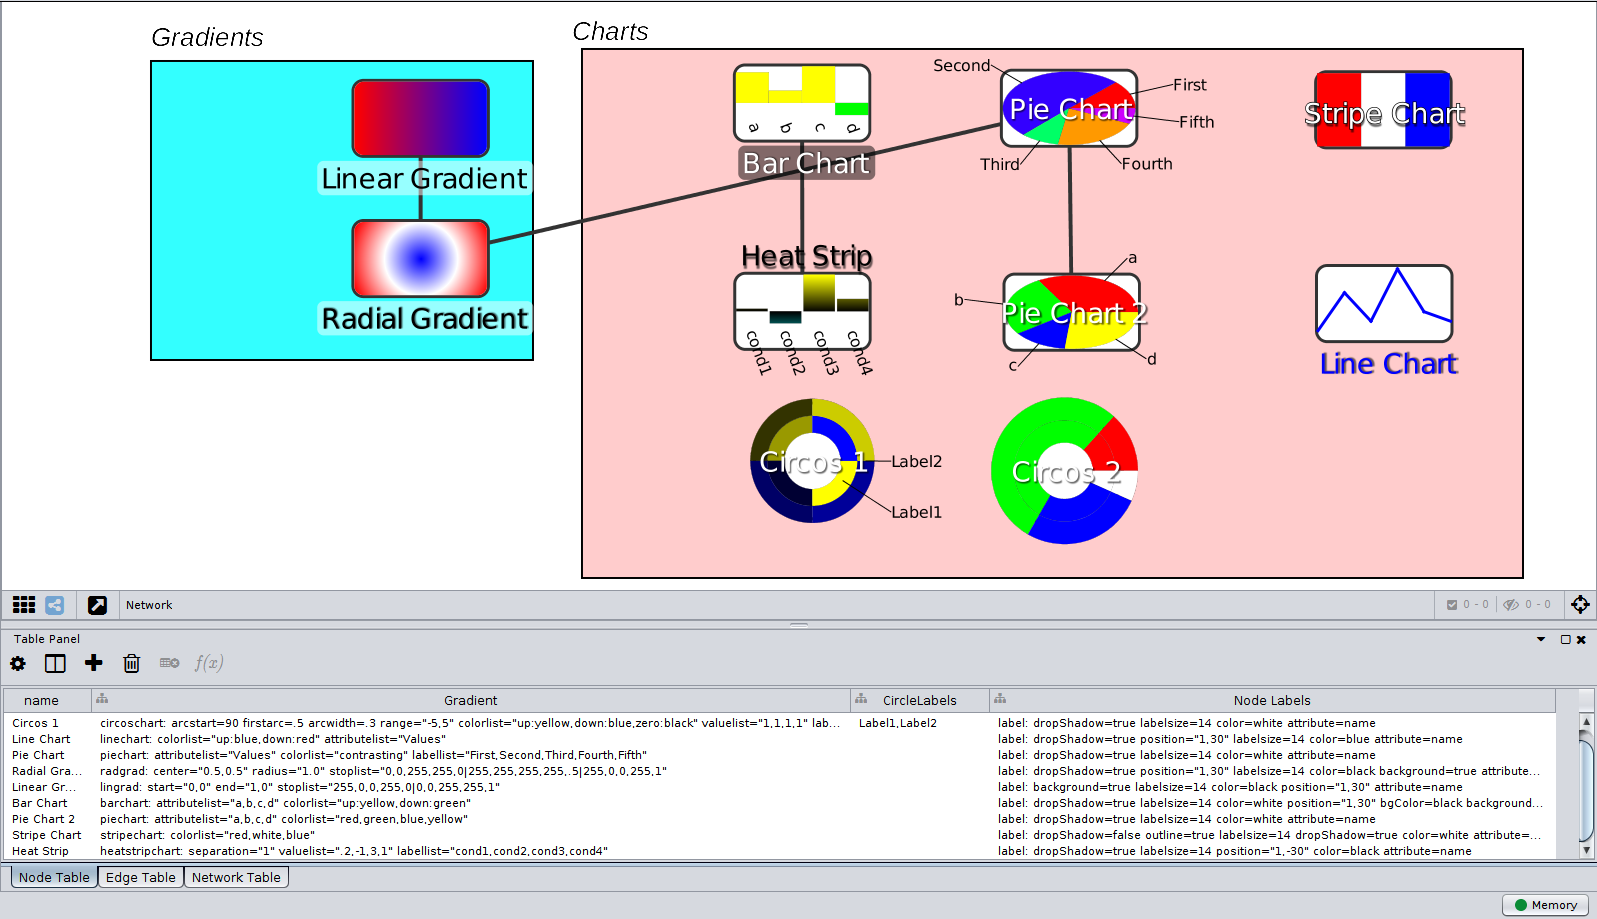
 * "Label" charts: * label: attribute=name labelsize=10 outline=true background=true color=white dropShadow=true Note that values can either be provided through a **valuelist** or through an **attributelist**. Colors can be by keyword or by providing a color for values above zero, at zero, or below zero. More documentation is being prepared and the development of a user interface to create these columns is underway.

1.5.5

Works with Cytoscape 3.3


1.5.4

Works with Cytoscape 3.3

Release Notes

Bug fix: - piechart can have one attribute per slice.

1.5.3

Works with Cytoscape 3.3

Release Notes

Bug fixes: - heatstrip color label - piechart can have values without attributes

1.5.2

Works with Cytoscape 3.3

Release Notes

- New feature: 'colorlist' of linechart can have UpDown colors. - Bug fixes.

1.5.1

Works with Cytoscape 3.3

Release Notes

Bug fixes: - label position - labels can have commas

1.5.0

Works with Cytoscape 3.3

Release Notes

This version has couple new features: * Added support of 'arcdirection' property for 'piechart' and 'circoschart'. * Added support of 'labelwidth' and 'labelspacing' to word-break long labels.

1.4.0

Works with Cytoscape 3.3

Release Notes

Added support for 'bordercolor'. Thanks for Marc Legeay from the University of Copenhagen.

1.3.0

Works with Cytoscape 3.3

Apps that depend on this release

Release Notes

This version has a couple of new features: * alpha value for colors * fixed but with circoschart label positions * can now use colorlist and valuelist to give a color to each slice of a circoschart within a ring Thanks for Marc Legeay from the University of Copenhagen for his contributions!

1.2.0

Works with Cytoscape 3.3

Apps that depend on this release

Release Notes

This release adds more capabilities for the "label" chart: * You can now set the width and transparency of the font outline. This allows for more elaborate shading effects. * There is a new "labelAlignment" option that allows you to set the alignment of the text to none, left, center, center_top, right, center_bottom, or middle.

1.1.1

Works with Cytoscape 3.3

Release Notes

More work on "label" chart. Fixed dropShadow to use a gaussian blur. Looks much better now.

1.1.0

Works with Cytoscape 3.3

Release Notes

Added a new chart type: **label**. Label charts allow users to add up to 9 labels to their nodes, and provide some slightly improved capabilities over the standard Cytoscape labels such as outlines, drop shadows, backgrounds, etc.

1.0.3

Works with Cytoscape 3.0

Release Notes

Sorry for the back-to-back updates, but the previous work pointed out that I really needed to support a more generic way to control the stroke width. The "borderwidth" property is now available for pie, bar, heatstrip, and circos charts.

1.0.2

Works with Cytoscape 3.0

Release Notes

Bug fix release. Fixes null pointer exception in case where data in attribute pointed to by the attributeList was empty.

1.0.1

Works with Cytoscape 3.0

Release Notes

Added Y-Axes support for bars and heatstrips. Enable by setting the graph range (e.g. range="-10,10") and setting showyaxis to true.

1.0.0

Works with Cytoscape 3.0

Release Notes

Fix a couple of bugs with matches between name and labels for pie charts. Also added some fixes for circos.

0.0.4

Works with Cytoscape 3.0

Release Notes

Updated to add consistent support font control: * labelfont="*font family*" - Set the family of the font * labelsize=*size* - Sets the font size * labelstyle=[plain|bold|italics|bolditalics] - Sets the font style * labelcolor="*color*" - Sets the font color

0.0.3

Works with Cytoscape 3.0

Release Notes

Updated to fix the contrasting color algorithm and added the ability to do gradients for pie slices. Its a little tricky -- essentially you provide both a valuelist and an attributelist. The attributelist data will be used to determine the gradient. If you want different colors, you give separate up/down/zero parameters to the colorlist separated by semicolons.

0.0.2

Works with Cytoscape 3.0

Release Notes

Rebuilt with Java 6

0.0.1

Works with Cytoscape 3.0


CYTOSCAPE 3

Version 1.5.5

Released 7 Nov 2022

Works with Cytoscape 3.3

Download Stats Click here