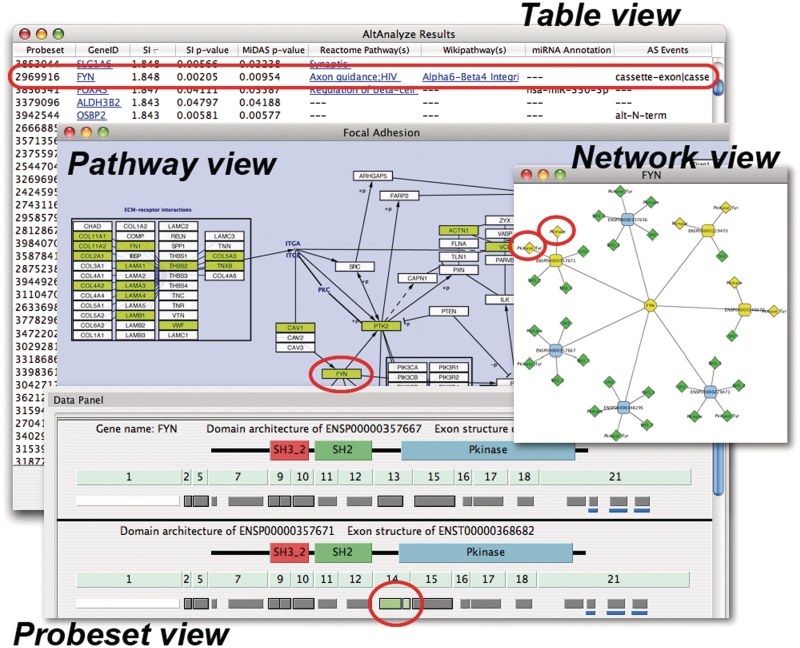
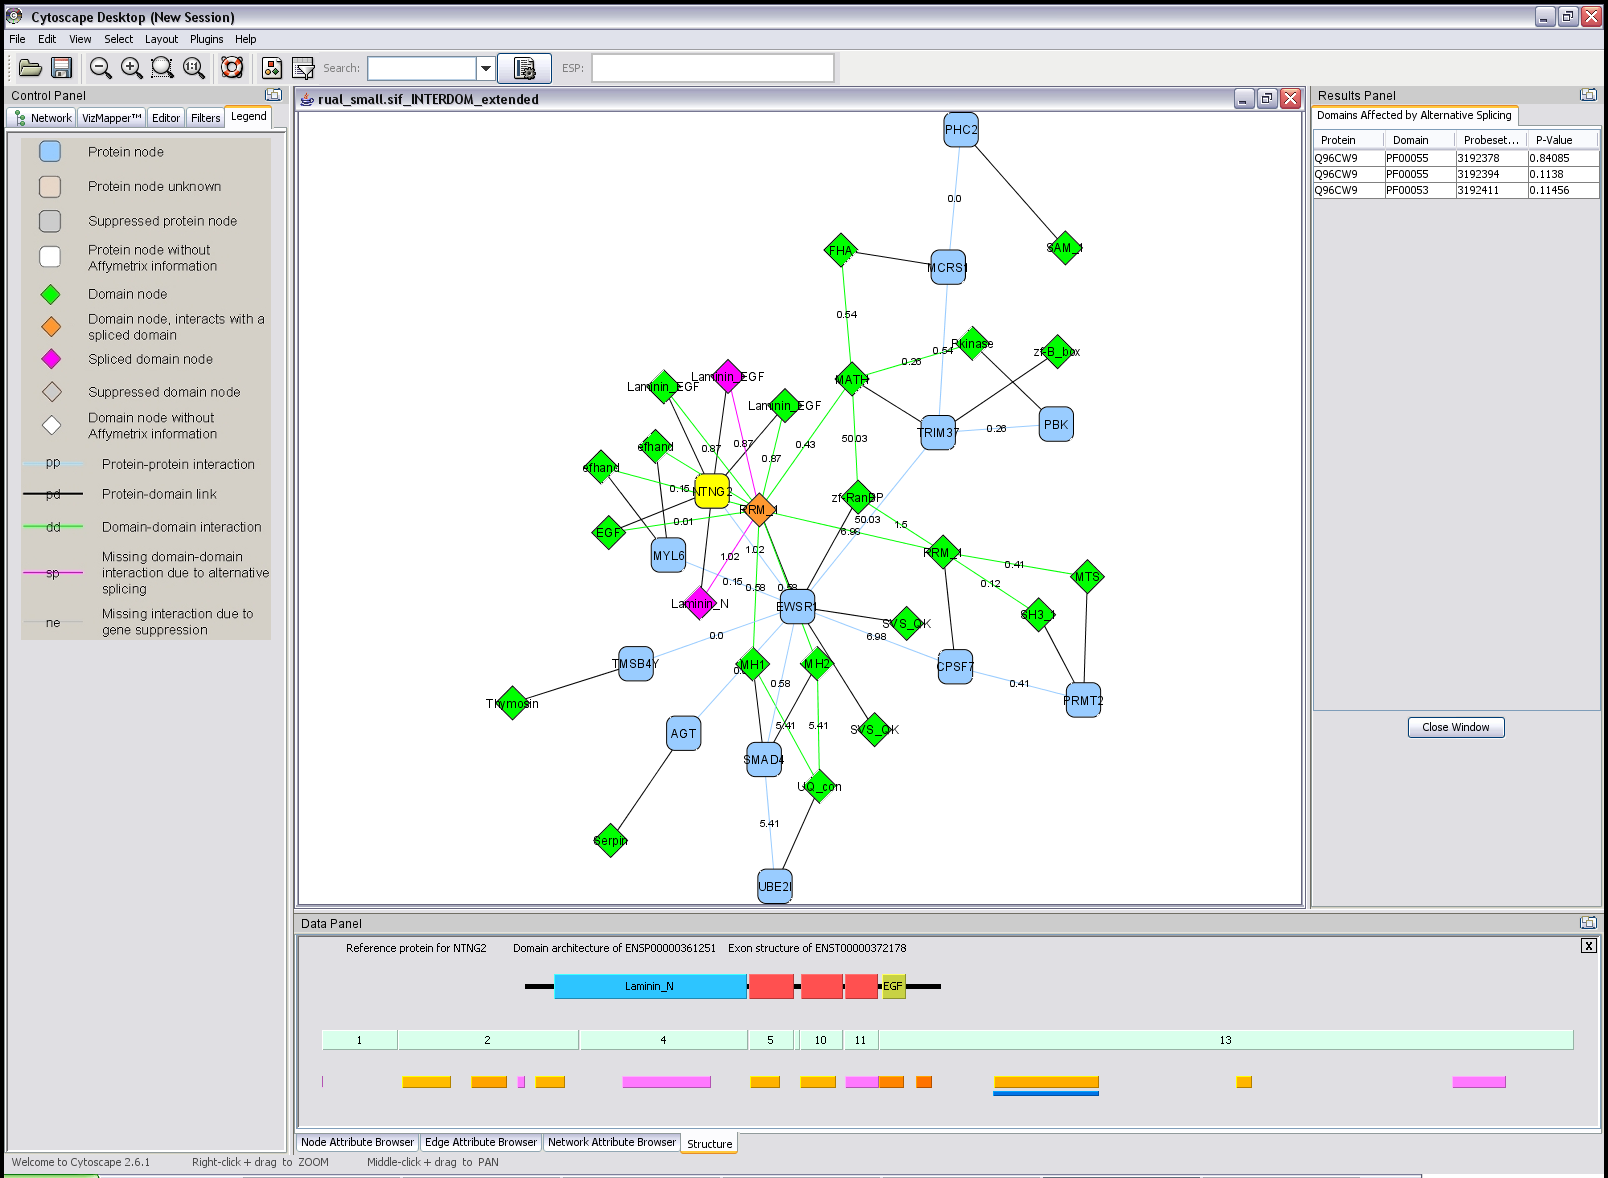
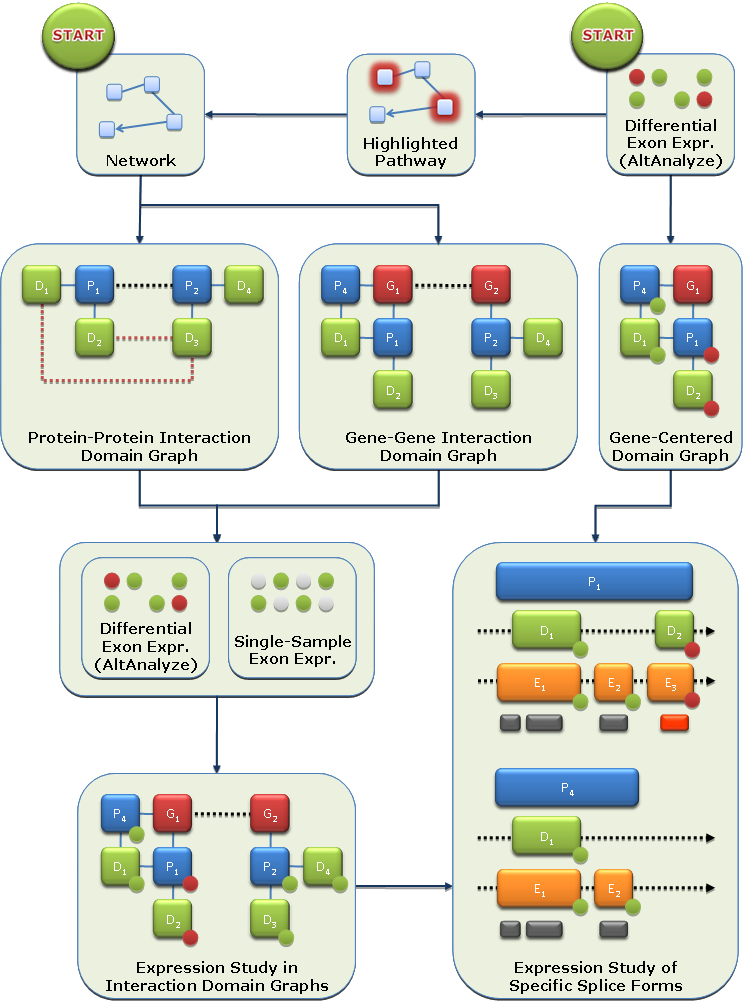
The main functionality of the DomainGraph plugin is the visual analysis of the effects of alternative splicing on genes, protein isoforms, molecular interactions, pathways and miRNA binding sites. Statistical results of Exon Array data computed with AltAnalyze can be imported into DomainGraph and affected genes, pathways and miRNA binding sites are automatically annotated. From these annotations, genes, gene products, and pathways can directly be loaded and visualized via DomainGraph and occurrences of alternative splicing are highlighted. Therefore, an in-depth analysis of Exon Array data regarding alternative splicing events and their biological impact is easily possible without the need of prior knowledge. Furthermore, the detailed analysis of interaction networks and pathways is possible. Given a gene interaction network, DomainGraph visualizes the genes together with all known encoded protein isoforms and their respective domain compositions. Given a protein interaction network, DomainGraph decomposes the proteins into their domains and visualizes the domain interactions underlying the protein interactions. These networks can be integrated with exon expression data produced by the Affymetrix Exon Array. Genes, protein isoforms and domains are highlighted according to potentially occurring alternative splicing events or differential expression in different groups of samples.