CyPlot version 1.0 is official release of the CyPlot package, which provides the ability to plot data through CyCommands/REST or from CyTable Data. In the version 1.0 release, interaction is through commands/REST. A menu interface is also provided under the tools menu. In the node table, an icon button can also grant access to the functionalities of CyPlot.
### Plotting Features Available:
1. Histogram Plot.
2. Scatter Plot
3. Volcano Plot
4. Line Graph
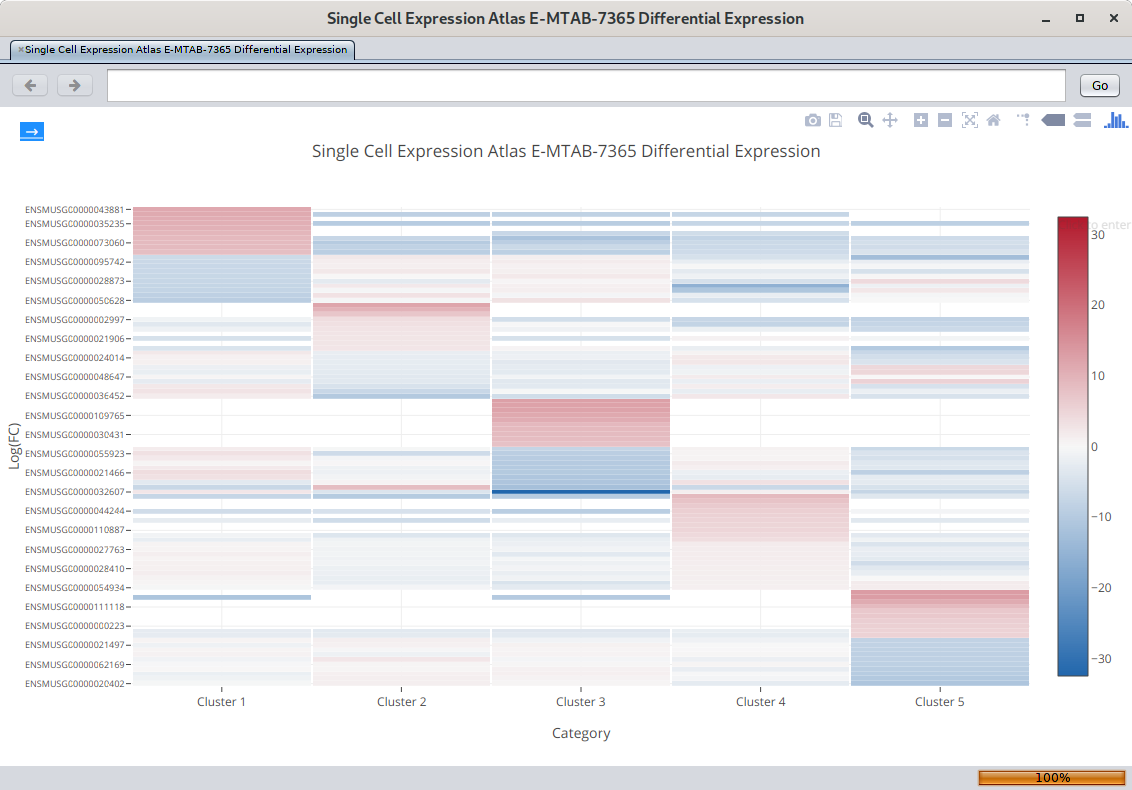
5. Heat Map
6. Filled Area Plot
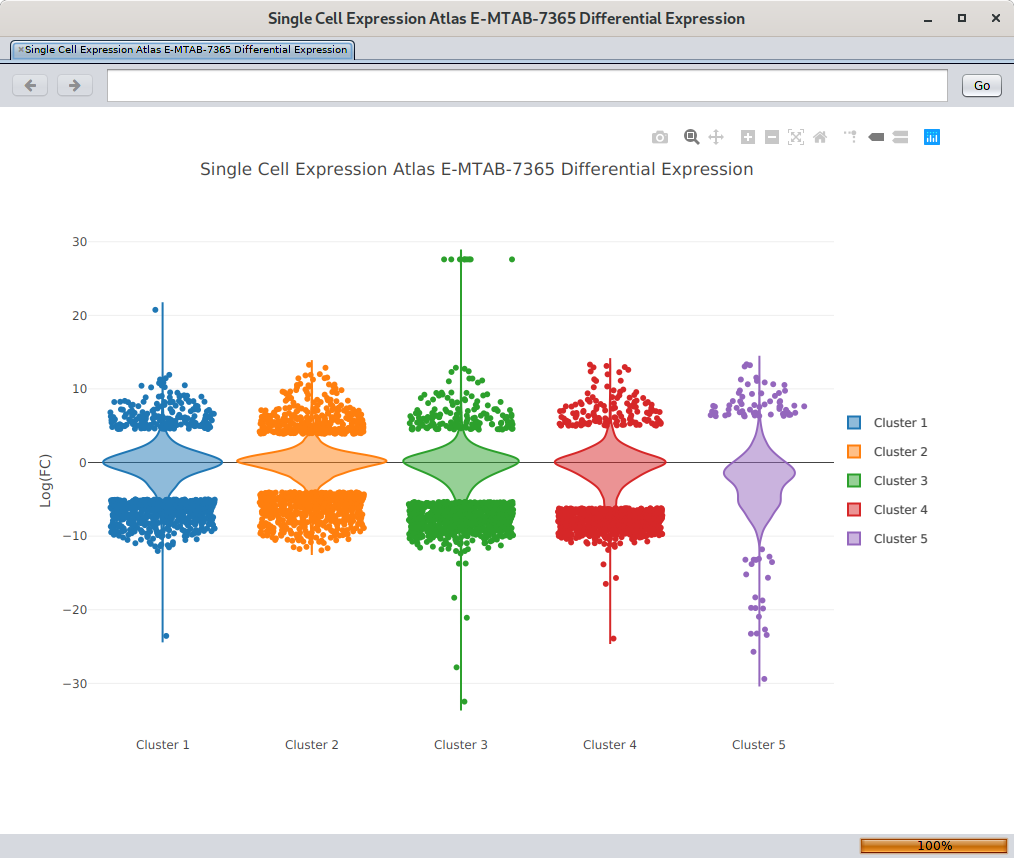
7. Violin Plot
8. Bar Chart
9. Graph Editor