MetScape

Maps human, mouse and rat metabolomics and gene expression data to human metabolic networks and enables pathway and correlation analysis.
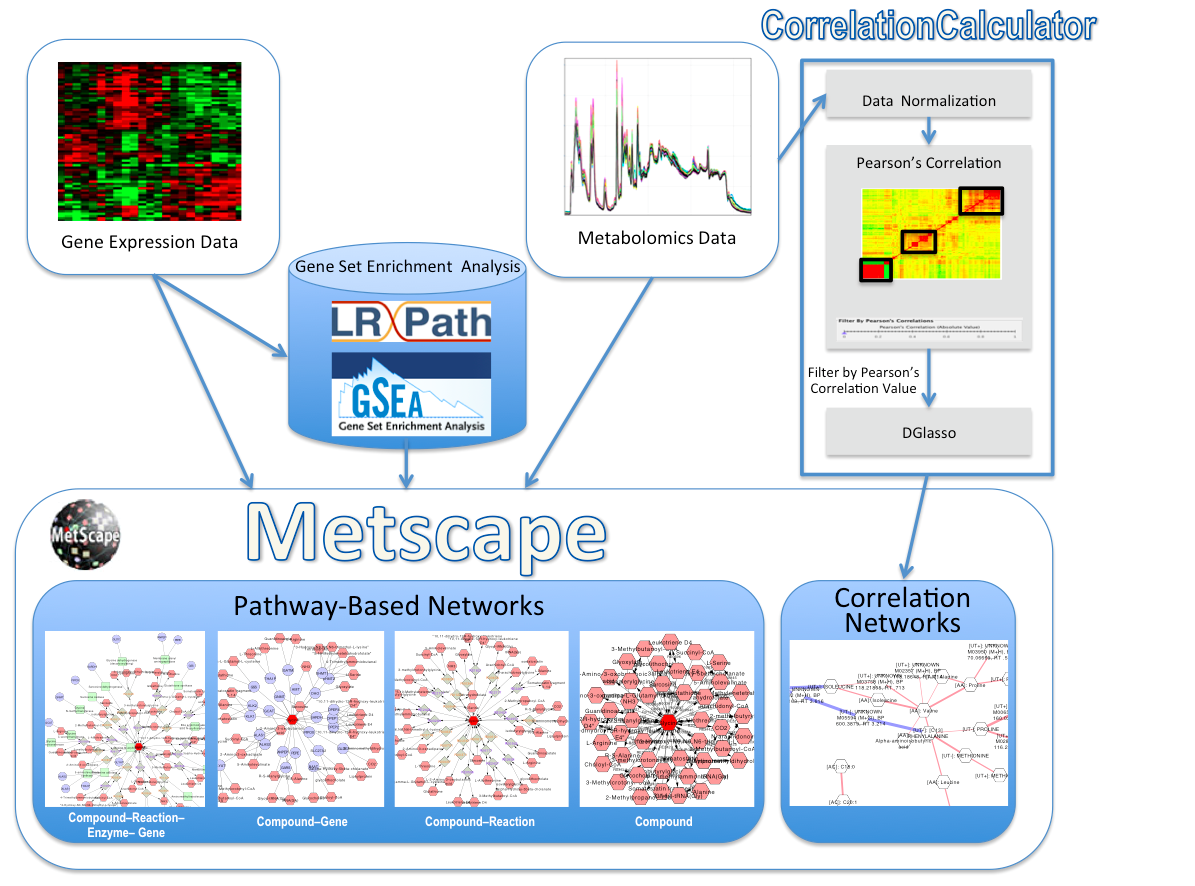
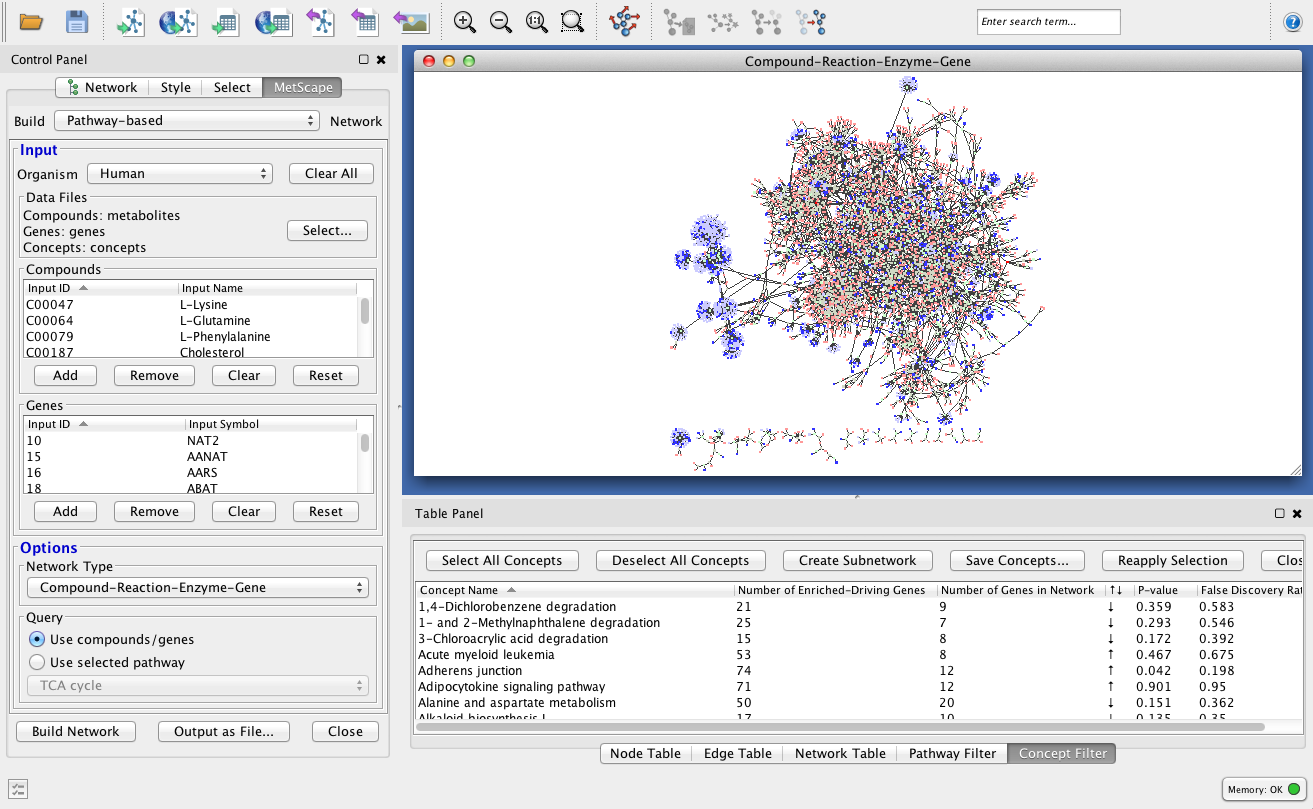
MetScape provides a bioinformatics framework for the visualization and interpretation of metabolomic data using Cytoscape. MetScape allows users to build and analyze networks of genes and compounds, identify enriched pathways from expression profiling data, and visualize changes in metabolite data. Gene expression and/or compound concentration data can be loaded from file(s) (in CSV, TSV, or Excel formats), or the user can simply enter individual compounds/genes/pathways (using KEGG, EHMN, or Entrez Gene IDs) to build metabolic networks without loading a file. MetScape uses an internal relational database stored at NCIBI that integrates data from KEGG and EHMN. 
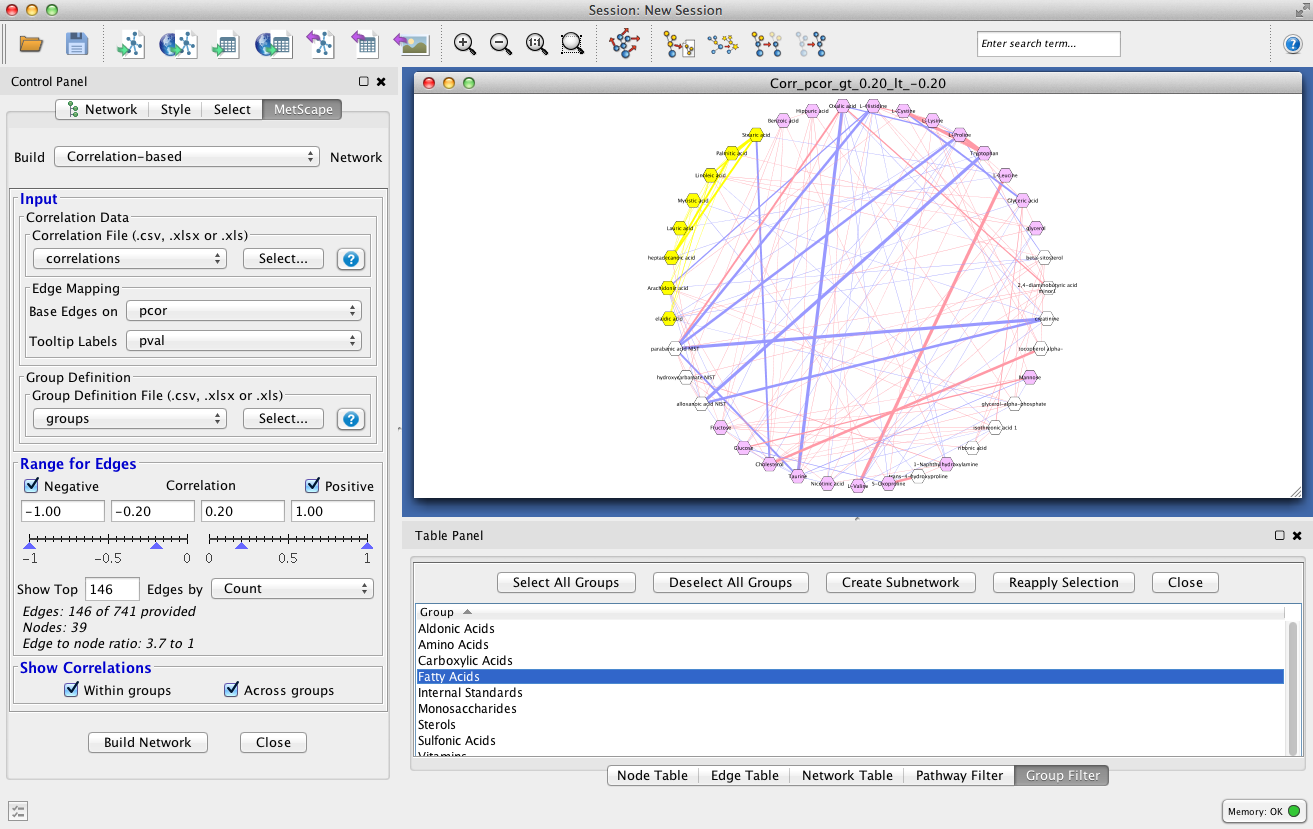
Starting with version 3.1, MetScape also provides the ability to build, visualize and explore correlation networks, where nodes are metabolites and edges are the correlations between them. Correlation networks can include both known and unknown metabolites. Correlation thresholds can be defined using sliders, and metabolites can be divided into groups with the capability of filtering on correlations within or across groups. As part of the correlation workflow, we introduce the [http://metscape.med.umich.edu/calculator.html Correlation Calculator], a standalone Java application providing the ability to import, normalize, filter and determine various correlation measures for MS or similar quantitative data. Correlation results can then be viewed interactively in MetScape as correlation networks. For more information please visit [http://metscape.med.umich.edu] or contact the MetScape development team: metscape-help@umich.edu This work developed at the University of Michigan, Department of Computational Medicine and Bioinformatics (DCMB), under National Institutes of Health Grants #U54DA021519, #U24DK097153 and #P30DK089503.

3.1.3

Works with Cytoscape 3.4

Release Notes

Note: This release only works with Cytoscape 3.4 and higher. Bug fixes: 1) Multiple users reported that the Build Network button was disabled for correlation-based networks in certain situations. This should no longer be a problem. 2) Subnetworks now retain visual styles and other properties of the parent network when built from the Pathway, Concept and Group Filter panels. 3) Vertical scrolling in the Pathway, Concept and Group Filter panels now works properly, including in cases where scrollbars were lost altogether. Animation: Changes in Cytoscape's handling of network views both architecturally and in the interface (and thus in the API as well) make direct sizing and positioning of network view windows, especially newly created ones, very difficult starting with Cytoscape 3.4. Consequently, we will no longer support the Animation feature of MetScape starting with this release. Those who wish to use Animation should do so using Cytoscape 3.3 or earlier and MetScape 3.1.2.

3.1.2

Works with Cytoscape 3.0

Release Notes

This is a compatibility release for users of Cytoscape 3.3.0 or higher. Changes have been made in the timing of the display of the user registration and compound/gene missingness dialogs. Users of Cytoscape 3.3.0 or higher should upgrade to this version to fix problems with using MetScape for the first time on a given machine (in which case they will be asked to register) and with remote launching of MetScape (e.g., from ConceptMetab or the CorrelationCalculator).

3.1.1

Works with Cytoscape 3.0

Release Notes

Bug fixes: 1) Right-clicking on a node in a pathway-based network now offers all possible actions (expand, collapse, restore, build subnetwork) rather than just one in situations involving subnetworks. 2) The filter panels (Pathway, Concept, Group) now track properly when switching back and forth among multiple networks. 3) There is no longer a long lag time when switching to an existing large network from another network.

3.1.0

Works with Cytoscape 3.0

Release Notes

Please visit [http://metscape.med.umich.edu] for full details. MetScape 3.1 adds the ability to build, visualize and explore correlation networks, where nodes are metabolites and edges are the correlations between them. Correlation networks can include both known and unknown metabolites. Correlation thresholds can be defined using sliders, and metabolites can be divided into groups with the capability of filtering on correlations within or across groups. As part of the correlation workflow, we introduce the [http://metscape.med.umich.edu/calculator.html Correlation Calculator], a standalone Java application providing the ability to import, normalize, filter and determine various correlation measures for MS or similar quantitative data. Correlation results can then be viewed interactively in MetScape as correlation networks. In addition to correlation networks, MetScape 3.1 features the following: * Network building is substantially faster, especially for large data sets. * When mapping named metabolites to compound IDs, the user's most recent choices are retained and become the new defaults in future mappings.

3.0.2

Works with Cytoscape 3.0

Release Notes

Bug fixes: 1) Selecting experimental data that includes a file of compounds labeled by name no longer results in a possible hang which forces the user to cancel the action and repeat it to get the compound selection dialog to work properly. 2) Expanding and collapsing network nodes (or any other action involving adding or removing nodes and/or edges) now triggers an update of the pathway and concept lists. 3) Restoring to the original network now works correctly rather than failing to do anything in some situations.

3.0.1

Works with Cytoscape 3.0

Release Notes

Bug fix: manually entering compounds or genes of which one or more cannot be found no longer results in a possible hang which forces the user to cancel the action.

3.0.0

Works with Cytoscape 3.0

Release Notes

Release 3.0.0 of MetScape is almost exclusively a port release to Cytoscape 3. To the extent possible, all features and interfaces of MetScape 2.3.3 were replicated. However, several minor changes were made due to the extensive architectural differences between Cytoscape 2 and Cytoscape 3. In addition, there are a few minor bug fixes and interface enhancements. The differences between this version of MetScape and the previous one include the following: - The look and feel of the Animation feature has been modified slightly in an attempt to make the feature more intuitive and the animation itself easier to interpret visually. - A number of attributes used in defining Visual Styles which were hidden in version 2.3.3 are visible in version 3.0.0. This is due to the fact that Cytoscape 3 does not support Visual Style elements that depend on hidden attributes. - Reaction nodes, which were displayed as squares in version 2.3.3, are displayed as diamonds in version 3.0.0 to help distinguish them from Enzyme nodes. - A minor bug involving loading of data columns with mixed positive and negative data values has been fixed. - Generating concept data using LRPath was previously done from within MetScape. We decided that a more appropriate workflow was to generate files from the LRPath website separately and then import these files into MetScape. There is a link to the LRPath website from MetScape's Select Experimental Data dialog to facilitate this process. Also, again due to the architectural changes in Cytoscape, we recommend that you re-create any old MetScape networks from scratch in version 3.0.0. We have made every attempt to support loading of 2.x networks and session files, for example implementing an interactive converter to handle the Visual Styles issue mentioned above, but there are likely some remaining incompatibilities.

CYTOSCAPE 3

Version 3.1.3

Released 3 May 2017

Works with Cytoscape 3.4

Download Stats Click here