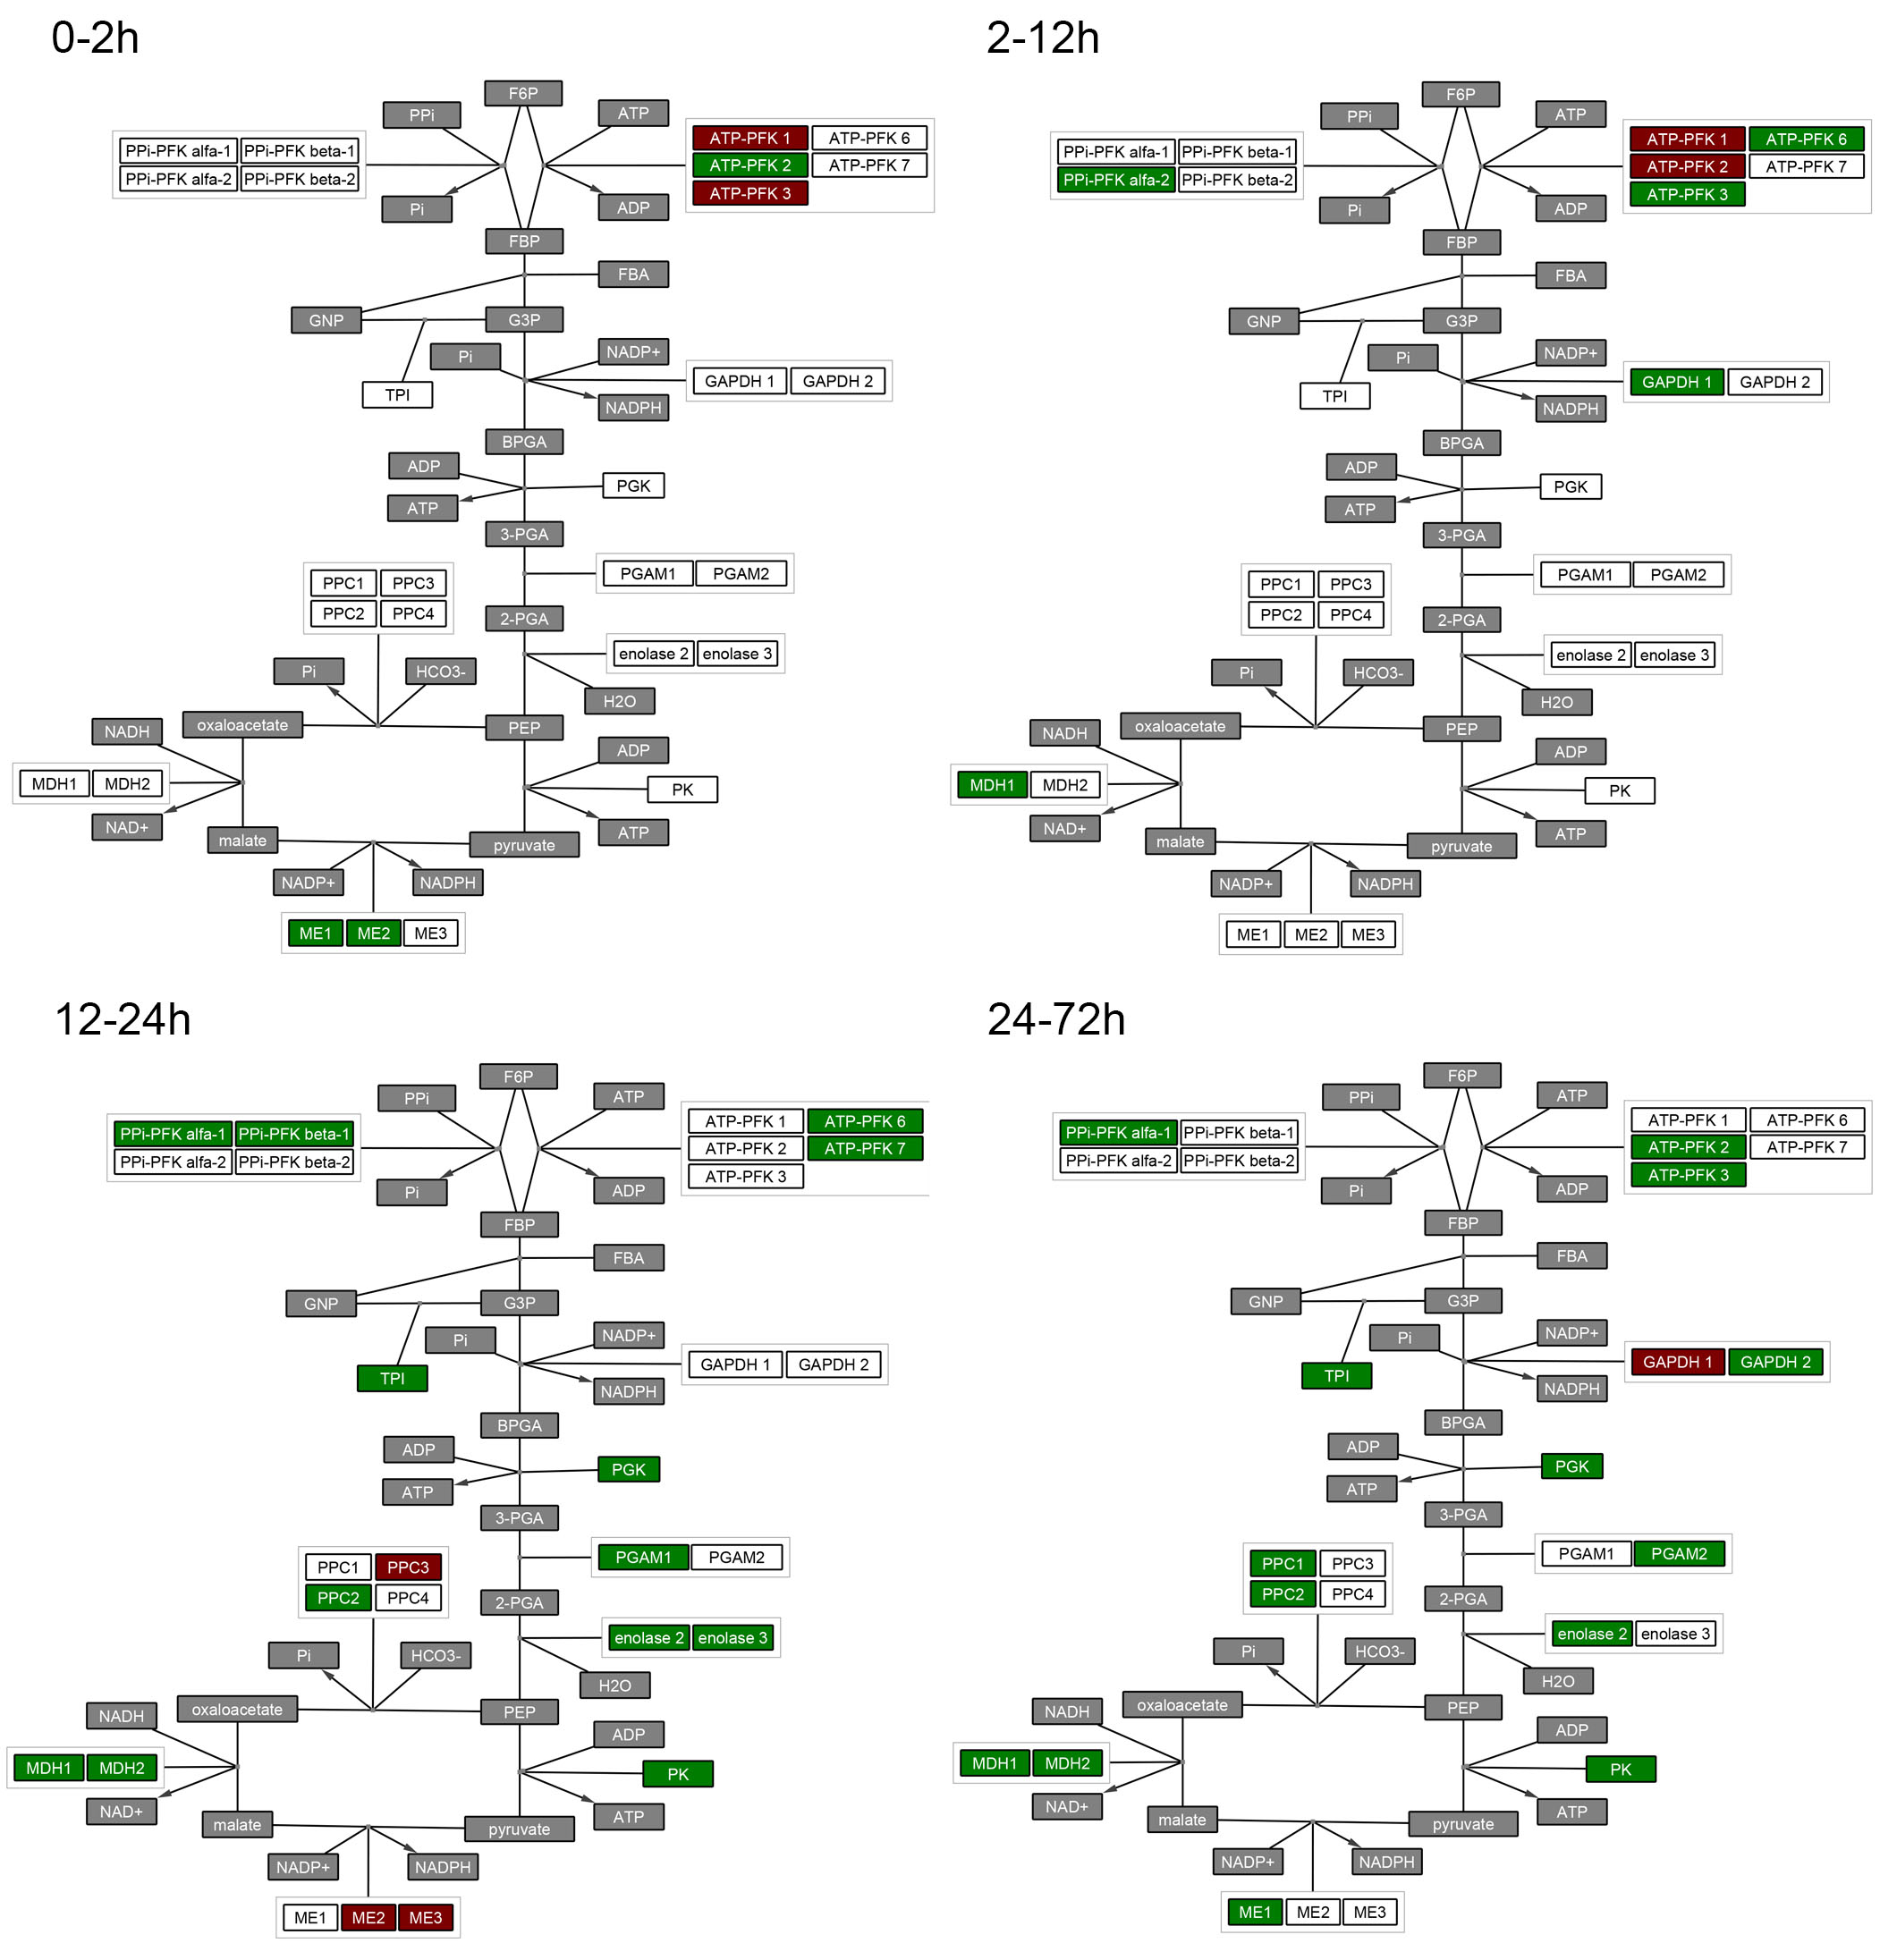
CyLineUp is a Cytoscape plugin that lets you import gene expression data and creates a ‘[https://en.wikipedia.org/wiki/Small_multiple small multiples]’ visualization from it. It does this by duplicating the currently active network as many times as there are samples (e.g. time points, stress conditions, different tissues, etc) in the dataset and uses the nodes’ background color to roughly indicate the amount of (or significance of) the up- or down-regulation.
See also our publication in the [http://f1000research.com/channels/cytoscapeapps F1000Research Cytoscape apps channel]:<br>
[http://f1000research.com/articles/5-635/v1 CyLineUp: A Cytoscape app for visualizing data in network small multiples]
### Short tutorial
### Step 1 – Loading network
In this tutorial, we provide a network file ready to use. This file consists of a biological pathway built in [http://www.pathvisio.org/ Pathvisio] and imported into Cytoscape through the App:
[http://apps.cytoscape.org/apps/wikipathways WikiPathways].
Start Cytoscape and load the network [http://www.bioinformatics.nl/CyLineUp/sample_network.cys sample_network.cys].
### Step 2 – Loading data
Load the data by pressing the button *Import data* in the CyLineUp menu and opening the file [http://www.bioinformatics.nl/CyLineUp/data_file.csv data_file.csv].
Ensure that the *Separator character* “,” (comma) is selected. The **DATA BINDING** panel pops up ([http://www.bioinformatics.nl/CyLineUp/figure1.png Figure 1]).
Change the *Identifier column* in network table to *shared name*, check the box *First row contains column headers* and press the button *Auto-detect from data*.
Press the button *Create small multiples*.
Cytoscape organizes the Small Multiple Views based on the order of the columns in the data file. Therefore, it is advisable to have in the first column the identifiers and the value (e.g. fold change) and the p-value for each treatment in subsequent columns. It is important that the names of the identifiers are the same in the data file and in the network.
### Step 3 – Customizing views
The user can customize the visualization to his/her needs by changing the Visual styles in the CyLineUp user’s interface ([http://www.bioinformatics.nl/CyLineUp/figure2.png Figure 2]). Nodes that have no data associated can be shown (default), greyed out or hidden. In case the nodes are hidden, the edges associated to them will also be hidden.
The default colors are green (HEX #00FF00) for up-regulated genes and red (HEX #FF0000) for down-regulated genes. The user can chose different colors by pressing the *Pick color* buttons.
After each change, the user can update the view of the small multiples by pressing the button *Update network views*.
### Step 4 – Exporting
The view of the small multiples can be exported using the CyLineUp interface (*Export SVG*). In this case, the small multiples are exported as panels of the same image. The user can also export each multiple as a separated file using the Cytoscape tool *Export network view as Graphics*.