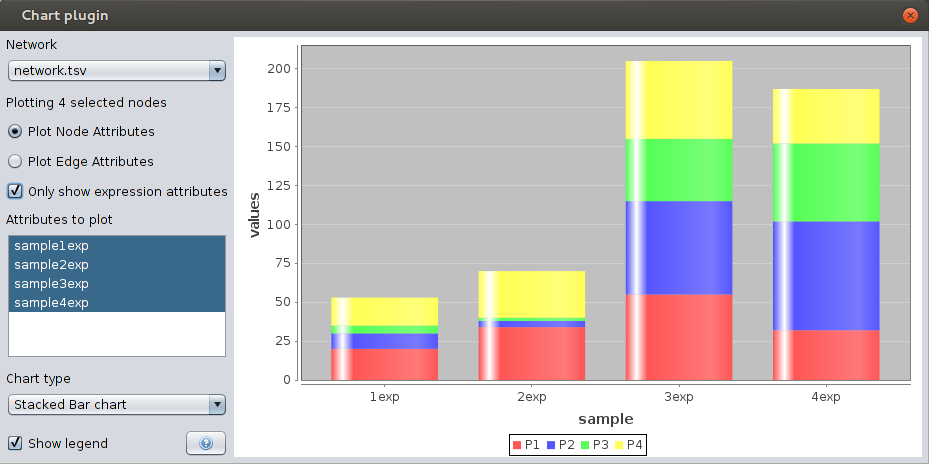
This plugin allows you to plot numerical node and edge attributes as five types of charts in eleven different layouts, to quickly give you insight into the attribute values of a selected group of nodes or edges when exploring a network. The chart types include: Area chart, Bar chart, Line chart, Pie charts and Waterfall. The chart updates live with each change to the selected nodes, edges and attributes to plot, to allow for uninterrupted browsing. Chart colors, fonts, title, labels and style can all be altered, and an export option to Portable Network Graphics (.png) is available. This plugin uses JFreeChart (<http://www.jfree.org/jfreechart/>) as the plotting library.
To aid in the selection of nodes to plot this plugin also gives you the option to select only the source nodes or target nodes in the entire network, or for the currently selected edges. This functionality can be used independently from the plot functionality, through the default Select-menu.