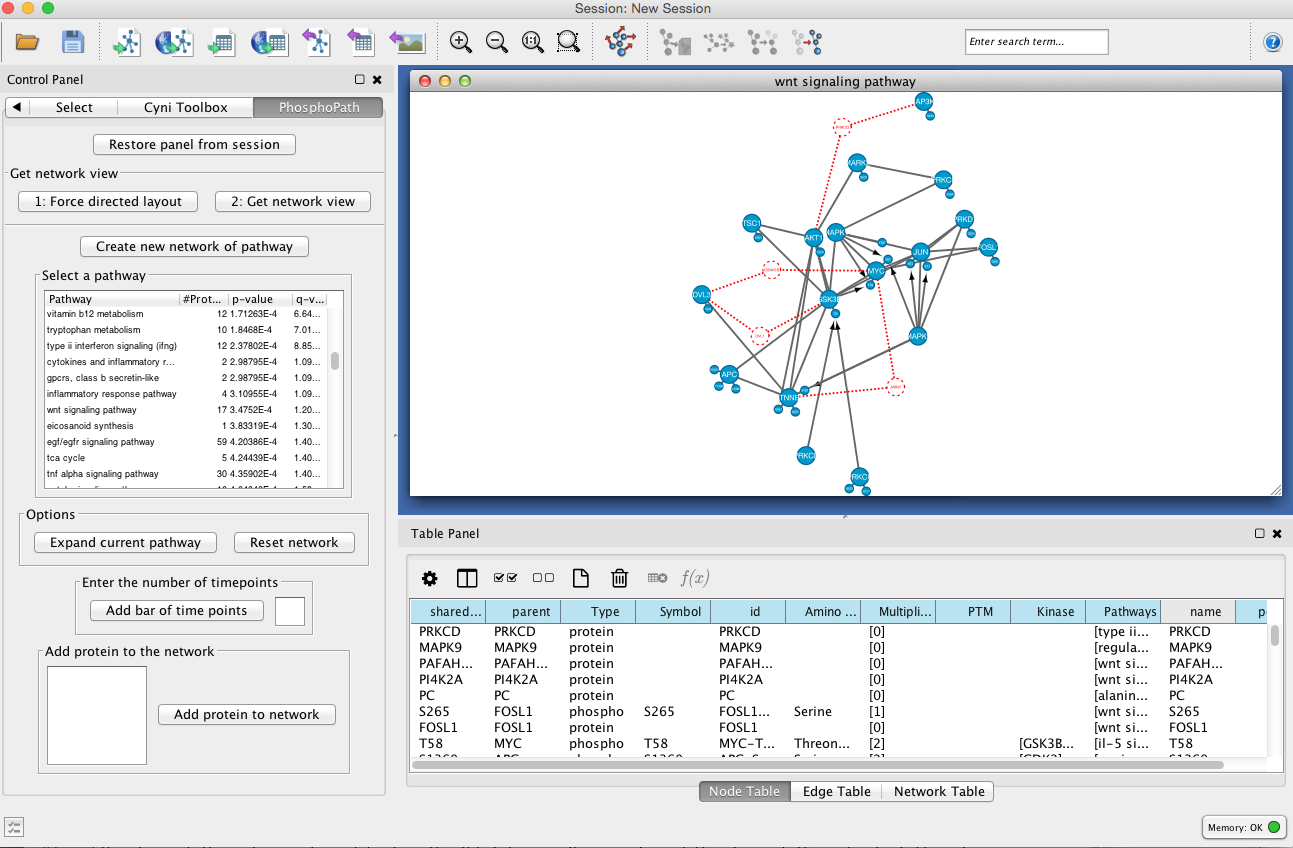
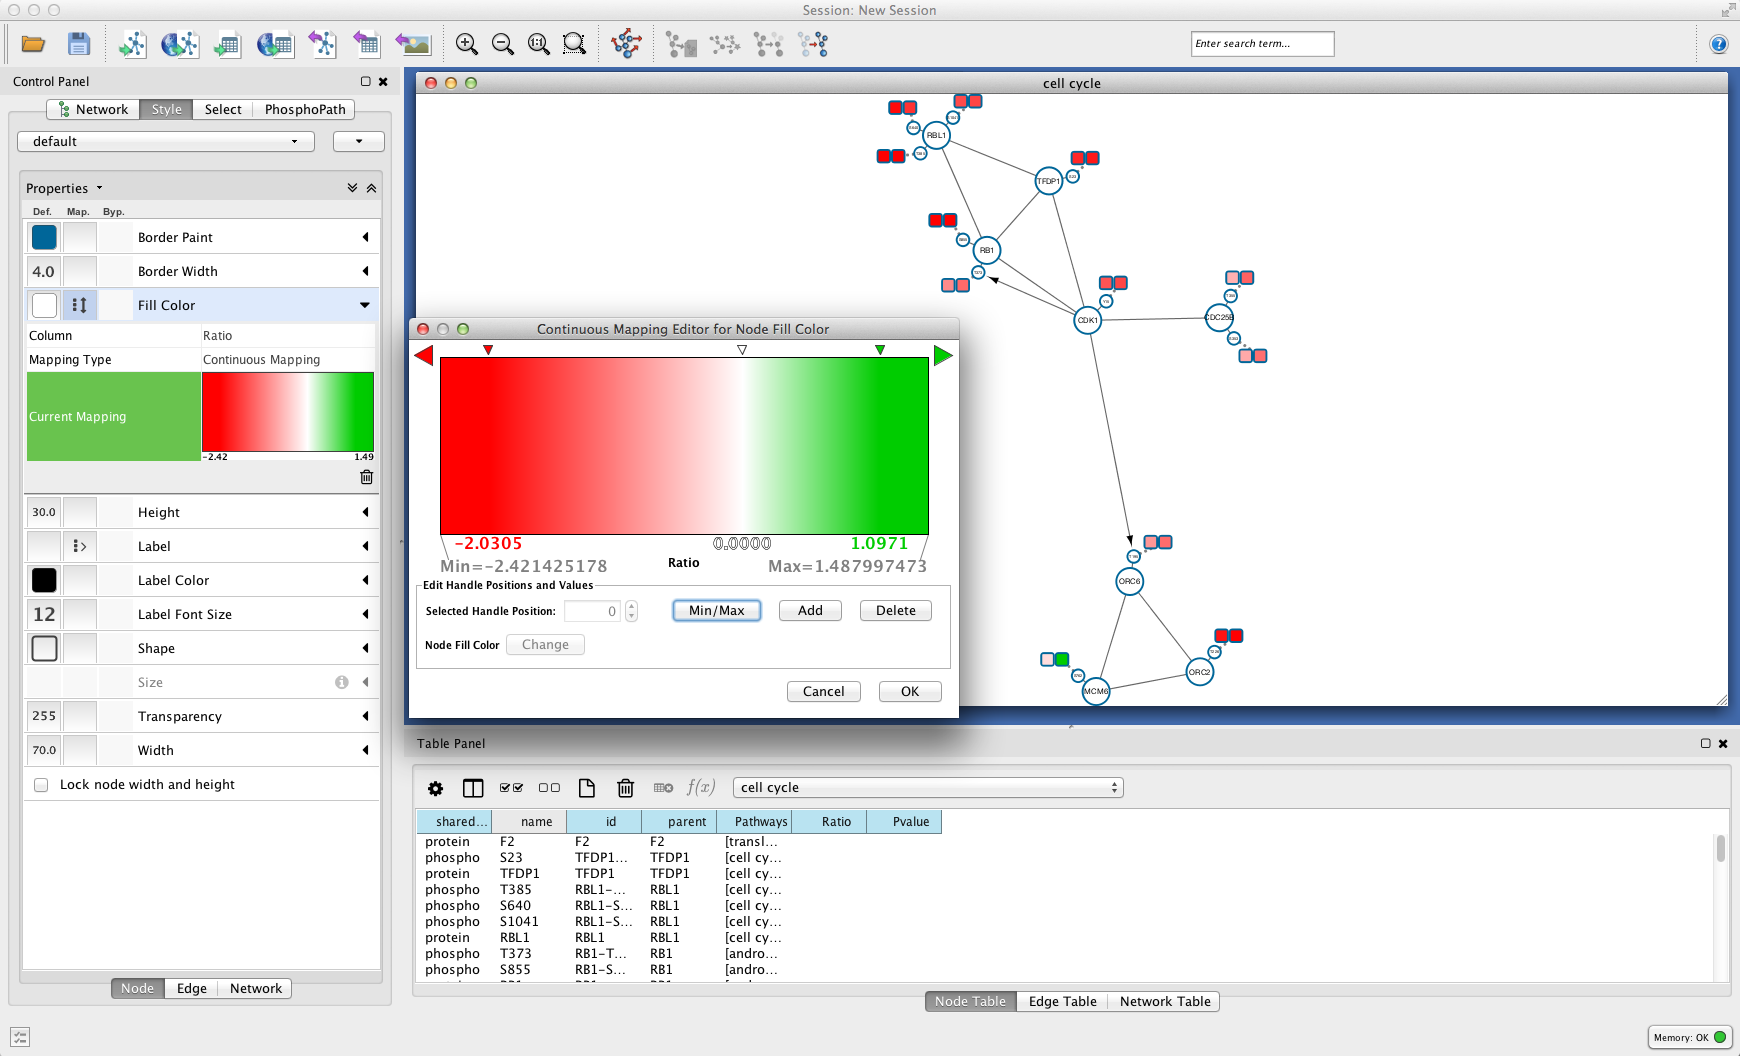
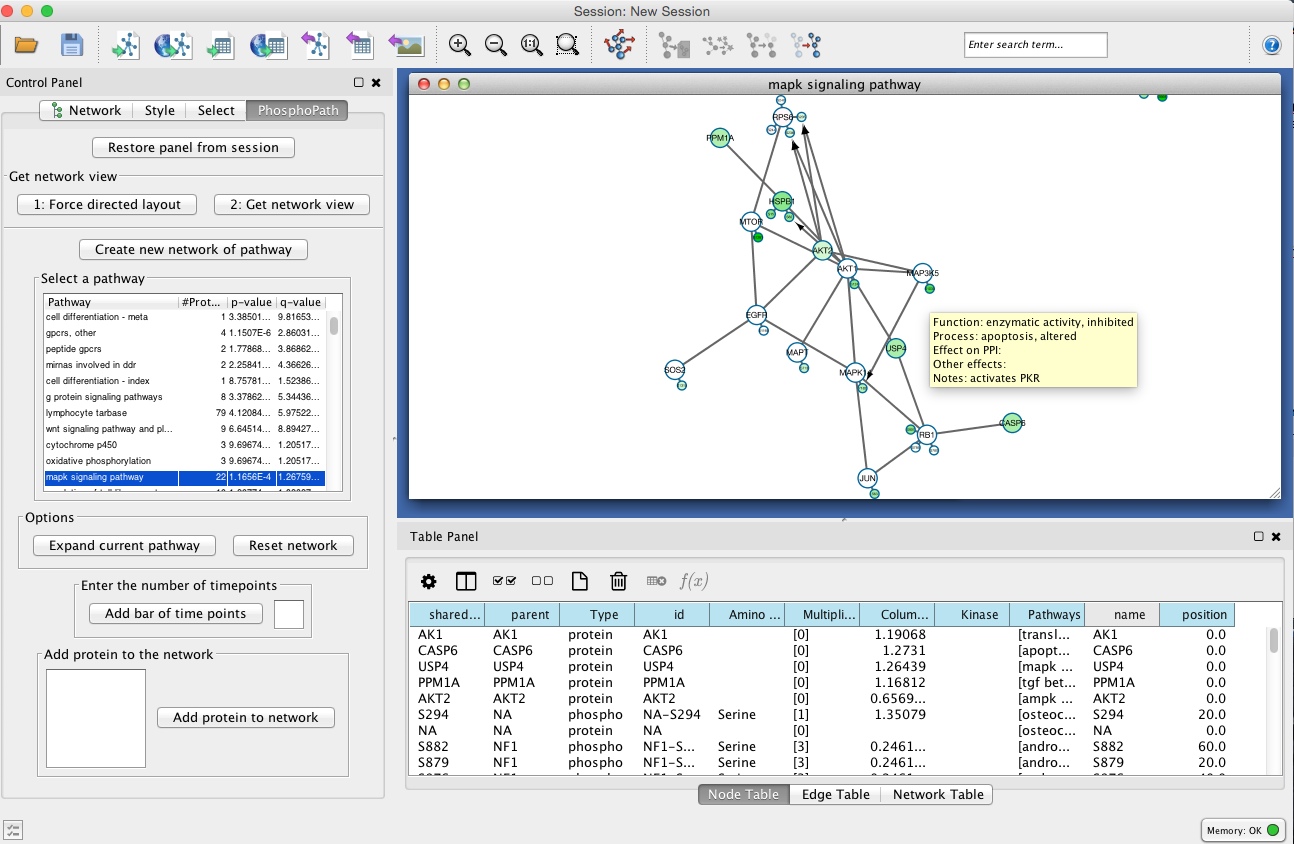
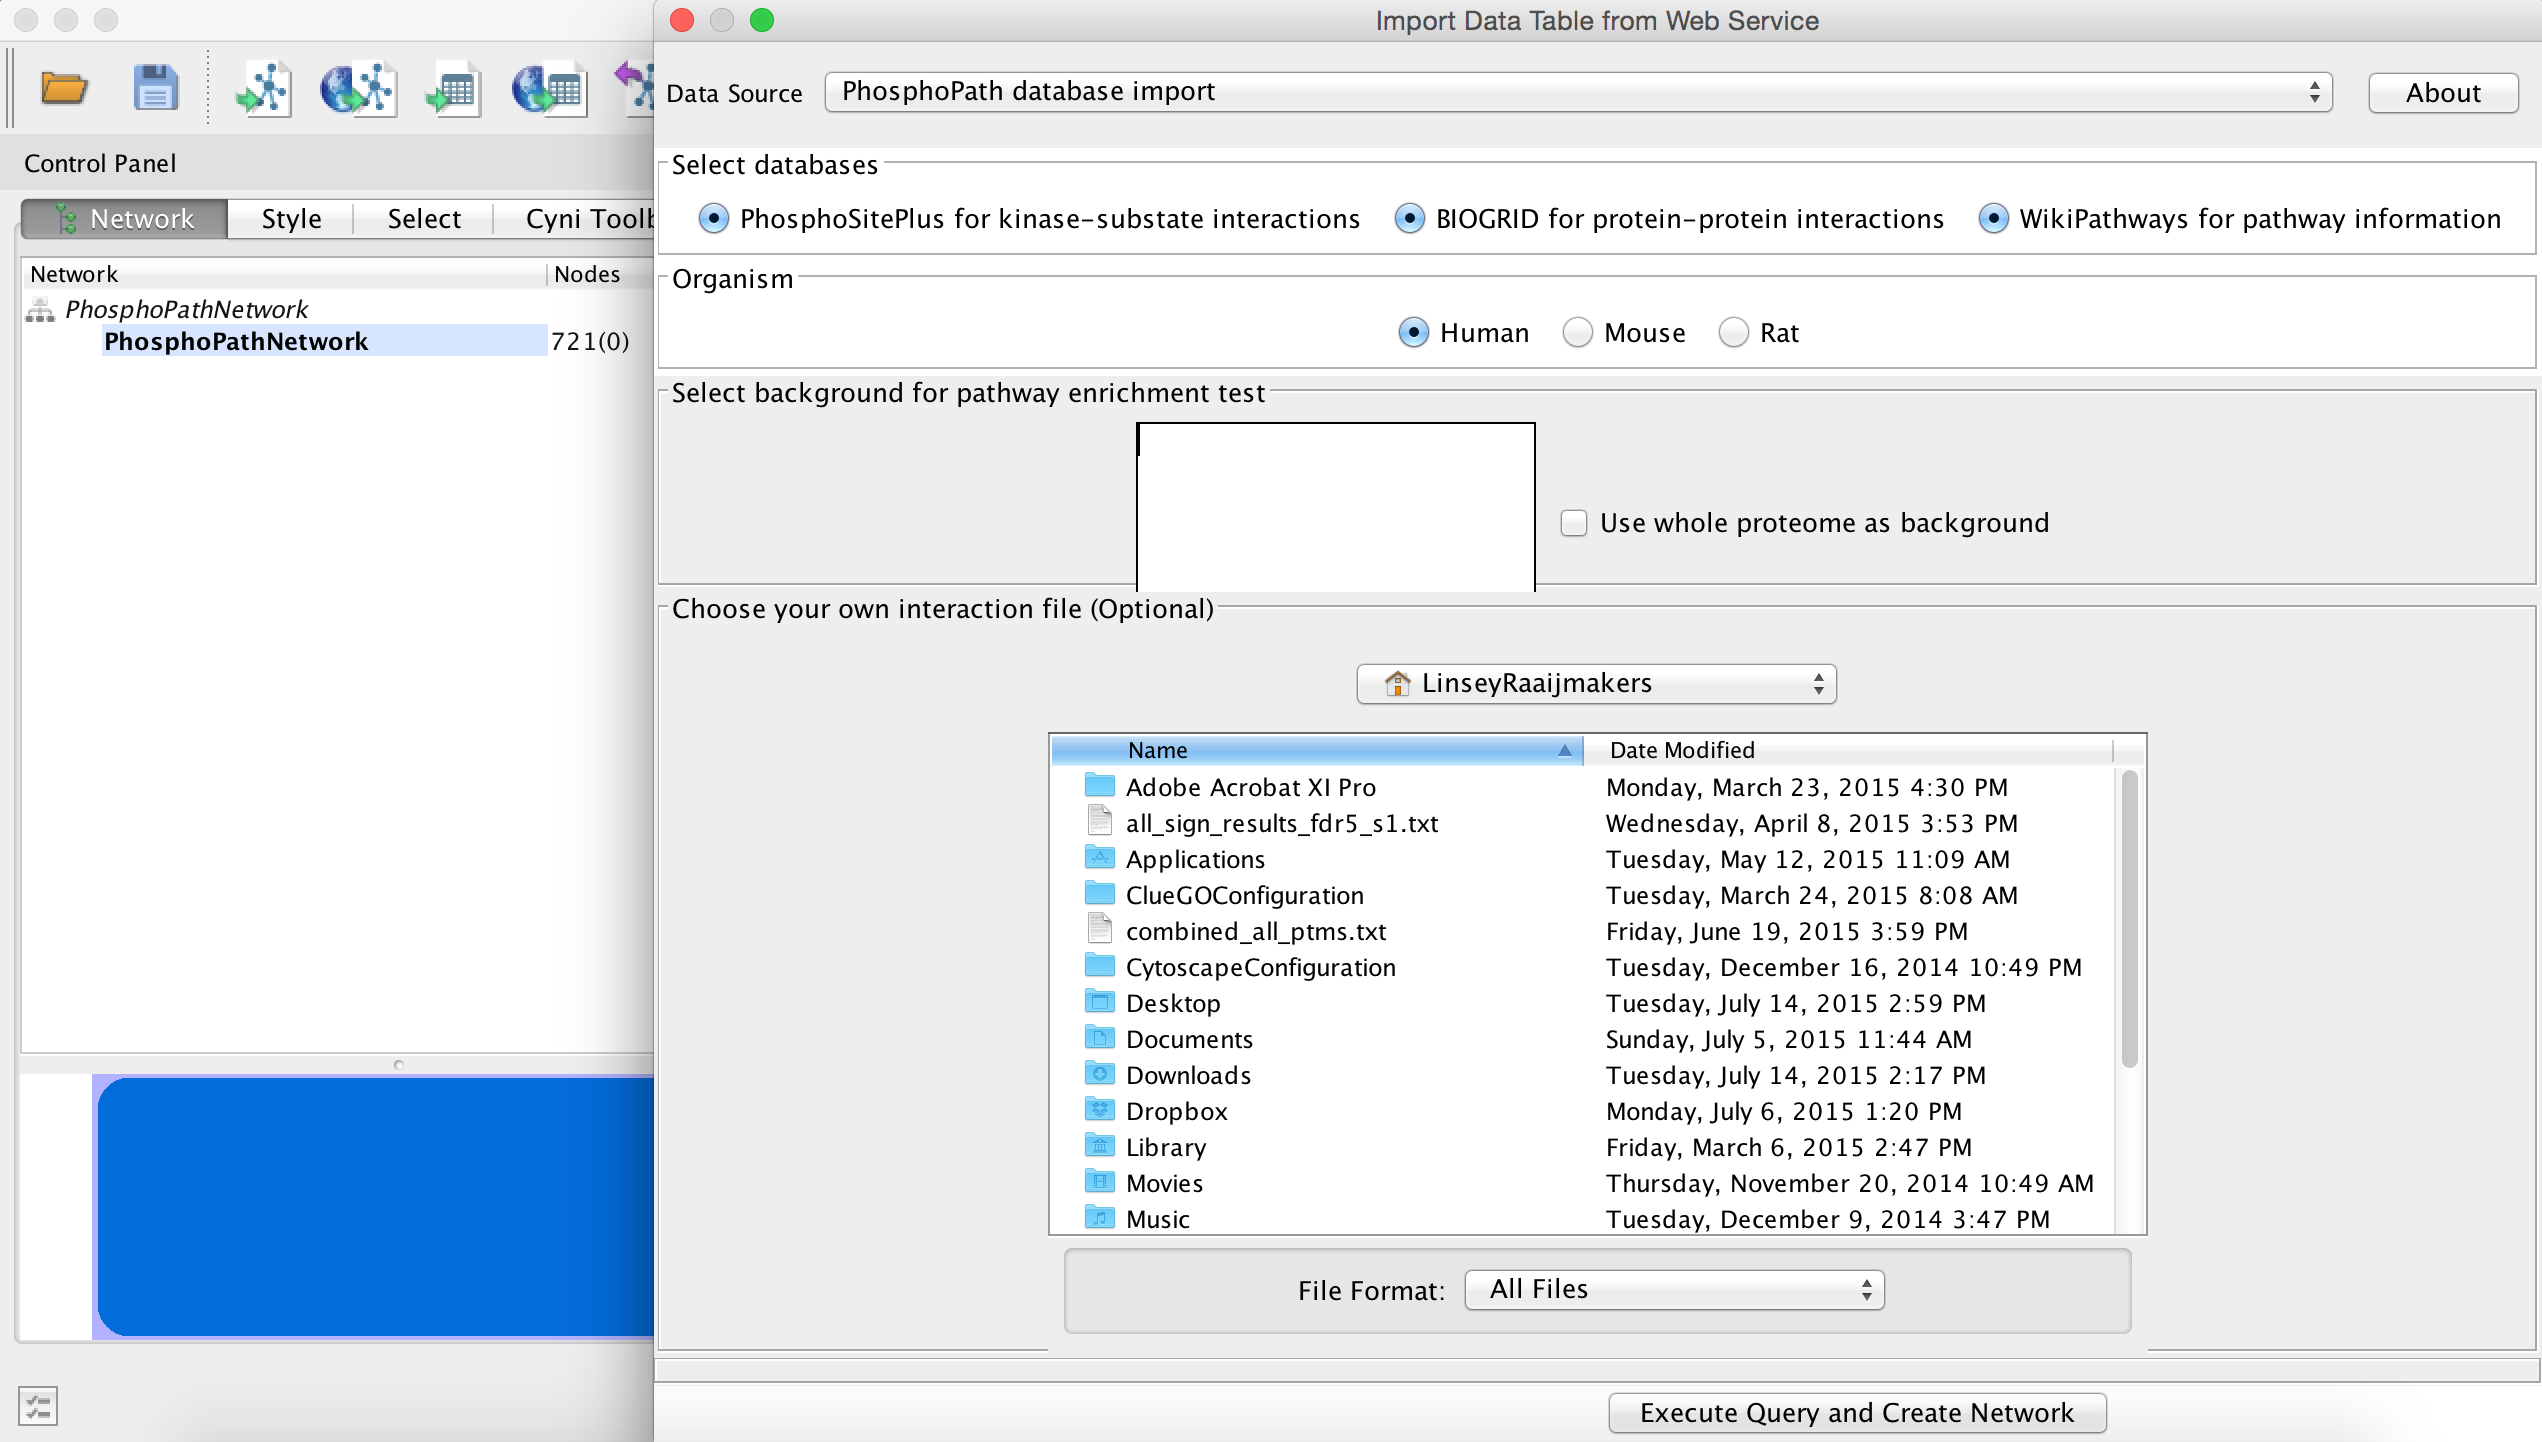
Here we present PhosphoPath, a Cytoscape app designed for the visualization and analysis of quantitative proteome and phosphoproteome datasets. PhosphoPath brings knowledge into the biological network by importing publically available data from three different public databases to identify protein-protein interactions (BioGrid) and kinase-substrate interactions (PhosphositePlus) and performs pathway enrichment (Wikipathways). PhosphoPath further enables PTM site-specific visualization of information from quantitative time series.
A manual with example dataset is available on github [http://github.com/linseyr/PhosphoPath]
When using PhosphoPath, please cite:
**Raaijmakers LM, Giansanti P, Possik PA, Mueller J, Peeper DS, Heck AJ, Altelaar AF.
PhosphoPath: Visualization of phosphosite-centric dynamics in temporal molecular networks.
J Proteome Res. 2015**